🔍 Using Machine Learning to Classify Personally Identifiable Data Fields
How I developed a solution to increase a client's data labelling process efficiency by 100-fold
This blog post was originally featured on the Cape AI Medium page.

I always jump at the opportunity to tackle new and interesting challenges using Machine Learning and Advanced Analytics. In the constantly changing field of AI, this is how I discover and push the bounds of what is truly possible.
1. The problem
Recently, I was tasked with a new challenge by a client who provides services related to secure sharing of consumer data. In order to strengthen their General Data Protection Regulation (GDPR) compliance and boost their clients’ trust, they wanted a solution that could help them automatically identify sensitive fields in their clients’ consumer data so that these could be encrypted appropriately. This was an important problem to tackle since all organisations and companies that handle data relating to EU citizens must comply with GDPR.
This is a two-part blog post where I am going to walk you through how I helped them solve this problem with some clever engineering and the help of Machine Learning!
2. Understanding the clients needs
The first step in my problem-solving process always involves engaging with the client to better understand their problem and agree on a set of solution requirements. So, what exactly was the problem? Let us unpack it a bit…
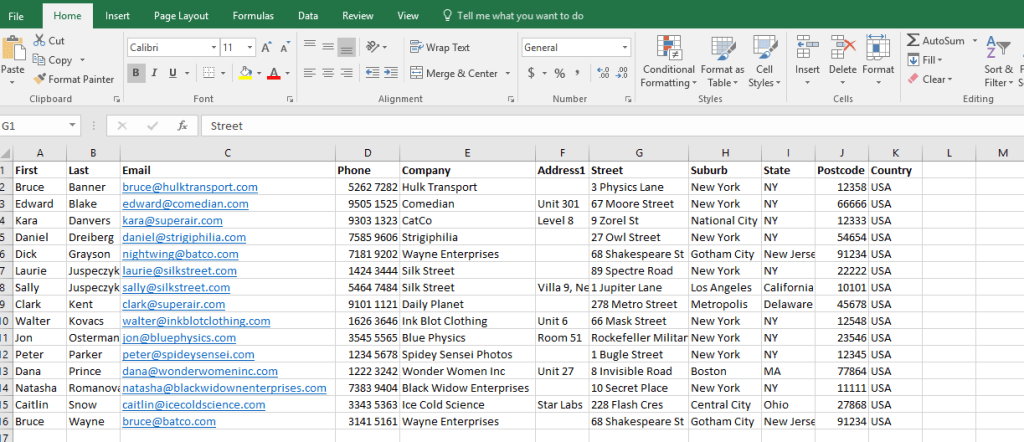
Roughly once a week, the client would receive new structured data tables like that in Figure 1, where rows denote consumers and columns various attributes related to these consumers. In essence, the problem entailed identifying so-called Personal Information (PI) columns that could be linked to a specific individual (e.g. name, ID number, phone number). To add further complications, there was hardly ever a predictable column structure in these tables and, on occasion, they contained junk data, or were missing data, in some cells.
After the first formal engagement with the client, I helped establish a set of requirements for the solution. More specifically, the solution should be:
- Able to Determine if a column is PI or non-PI, and allocate a PI column to one of 7 categories: (1) first name, (2) last name, (3) ID number, (4) phone number, (5) email address, (6) date-of-birth (DoB) or (7) Vehicle Identification Number (VIN).
- Packeged as a production-ready system that is able to self-improve through implicit feedback gathered by clients engaging with the model.
In this blog post, I’m just going going to describe how I addressed the first requirement and we’ll save the second requirement for Part 2!
3. Rapid development
The next step in my problem-solving process typically involves rapid analysis and developing a proof-of-concept to demonstrate how my proposed solution would work and the value it offers.
Time for some Machine Learning!
Upon reviewing the requirements again, it was clear that this problem could be framed as a classification problem (something I previously discussed in my Supervise Learning blog post). In this case, if I had a bunch of examples of first and last names, phone numbers, ID numbers, DoB, email addresses and VINs, each labelled as such, we could train a multi-class supervised learning model, such as Logistic Regression. This model could then be used to classify each new “string” as one of the above labels (a catch-all term for sets of letters and/or numbers in this context). Luckily, the client had many examples of these different categories on hand!
But there was just one problem: to train a supervised model, we needed a set of features that could appropriately characterise similar strings belonging to different categories — a phone number and an ID number, for example. The idea was therefore to construct a set of informative features using Regular Expressions (RegEx). Table 1 shows the 17 features that were constructed together with a RegEx description of each feature and the category the feature was intended to target. Feature 10, for example, checks whether the 7th character in the string is either a “0” or a “5” since, at least when dealing with South African IDs, would indicate whether a person is male or female, respectively.
| # | Feature name | Target category | RegEx description |
|---|---|---|---|
| 1 | countLength | All | Count # of characters in string |
| 2 | countUpper | Name & VIN | Count # of uppercase characters in string |
| 3 | countLower | Name & VIN | Count # of lowercase characters in string |
| 4 | countNumerical | Name | Count # of numbers in string |
| 5 | countSpace | Last name | Count # of spaces (‘ ’) in string |
| 6 | countDashesSlashes | DoB | Count # of dashes (‘-’) and forward slashes (‘/’) in string |
| 7 | countVowels | First name & Last name | Count # of vowels in string |
| 8 | countConsonants | First name & Last name | Count # of consonants in string |
| 9 | checkCitizen | ID number | Check if 3rd to 2nd last characters are ‘08’ |
| 10 | checkGender | ID number | Check if 7th character is either ‘0’ or ‘5’ |
| 11 | checkCountry | Phone number | Check if string starts with ‘27’ or ‘+27’ |
| 12 | checkArea | Phone number | Check if 2nd to 4th characters are area code numbers |
| 13 | checkPrefix | Last name | Check if string starts with common surname prefixes |
| 14 | checkSyllables | Name | Check if string contains syllables |
| 15 | checkEmail | Check if string contains ‘@’ or ‘.’ | |
| 16 | checkFirst | First name | Check if string is in list of first names |
| 17 | checkLast | Last name | Check if string is in list of last names |
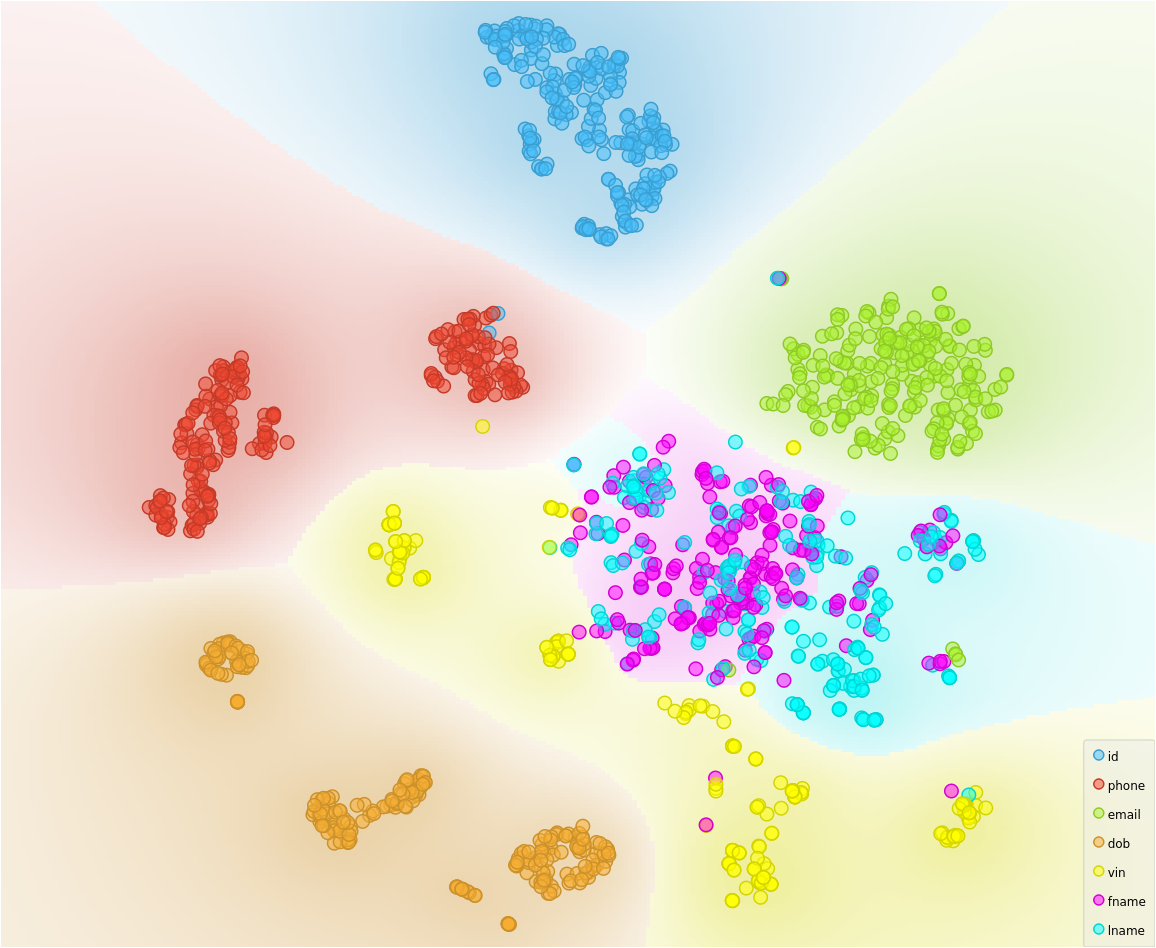
Before jumping straight to training the model with my newly constructed features, I wanted to get a bit of an intuitive feel of the feature space I had constructed. Figure 2 allows just that, showing the result of squashing the 17-dimensional feature space down to only two dimensions with the help of a dimensionality reduction technique called Uniform Manifold Approximation and Projection (UMAP). It seemed like the RegEx features did a pretty good job at separating out the 7 categories.
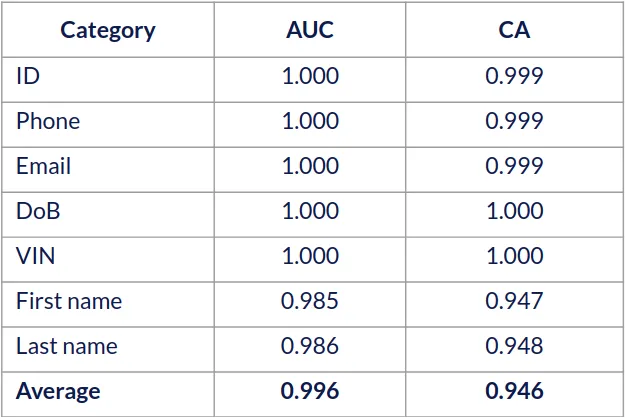
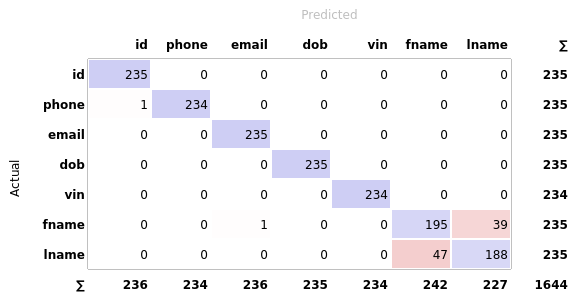
Since the feature space appeared pretty linearly separable, at this point it seemed reasonable to assume that Logistic Regression wouldn’t have much of a problem distinguishing between the categories (with maybe the exception of first and last names), and that is exactly what I observed. Below, in Figure 3, you can see the Area Under the Curve (AUC) and Classification Accuracy (CA) results for each category (using 10-fold cross-validation), together with the corresponding confusion matrix, which shows the difference between the actual categories and the ones predicted by the Logistic Regression model.
With this in mind, I had enough confidence to progress further with this idea and develop it into a consumable and concrete solution for the client.
4. Defining the process flow
One natural idea that occurred to me at the beginning of the project was to determine the column categories based solely on clever RegEx formulations. Indeed, this would be quite easy for categories such as email addresses, phone- and ID numbers, but a lot more difficult for columns that contained, say, a person’s name. Nonetheless, I realised that it would be foolish to let my Logistic Regression model predict a column category if we could already say, for certain, that it belonged to a specific category based on the value of a certain RegEx feature. Take, for example, a string that contains an at-sign (“@”) — it wouldn’t seem too crazy to immediately assign this column to the “Email” category if we observe the first 10 records subscribing to this pattern. With this notion in mind, we decided to impose some features as having a so-called assign condition which would facilitate this automatic assignment of a column to a specific category.
Figure 4 describes my proposed process flow for predicting whether a column is PI or non-PI, as well as the corresponding category (if the column is PI). Starting from the top, a number of string records are sampled from the column in question. For each string record, a feature value is computed according to the set of defined RegEx features. If the feature currently being computed has an assign condition, the total proportion of records satisfying this condition is calculated and compared to a category assignment threshold.
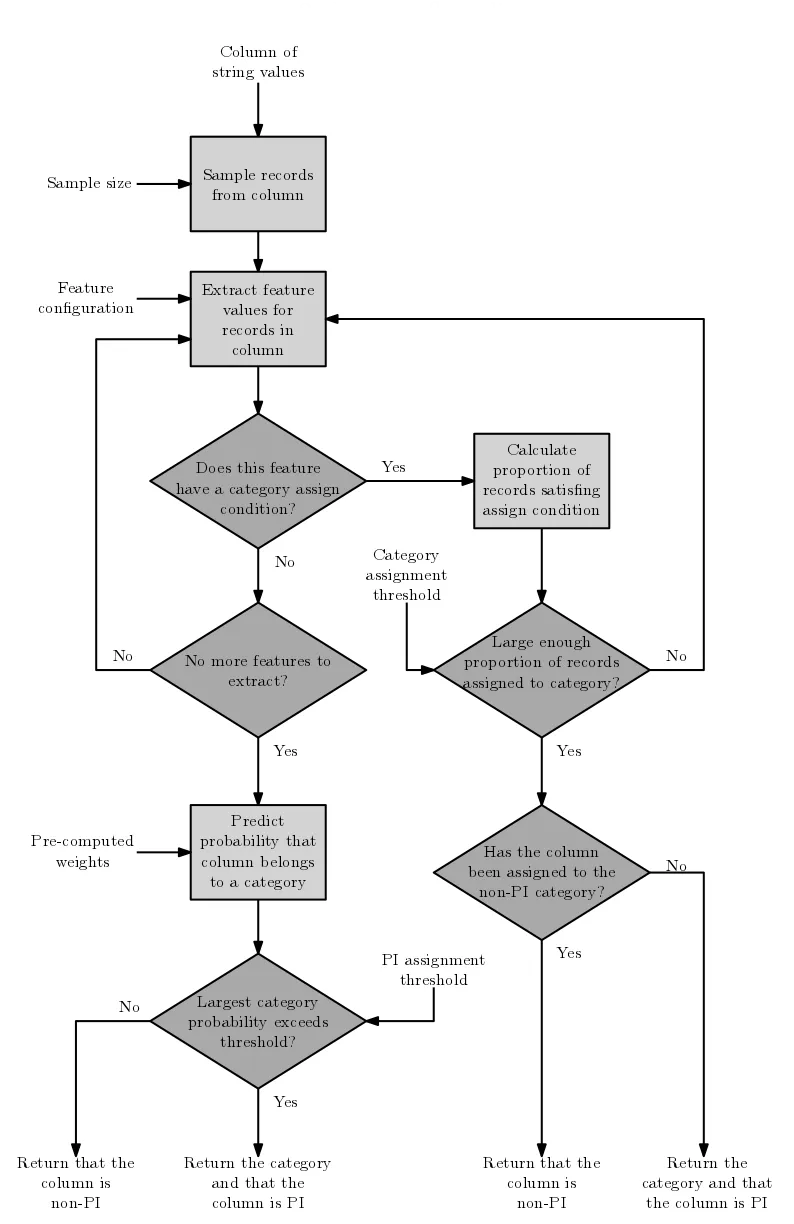
As a way of explanation, consider an example where 100 records have been sampled from a column and a category assignment threshold of 0.1 (or 10%) has been specified. If the feature under consideration is checking whether the string record contains a “@”, the column will immediately be assigned as a PI column with the category of “Email”, if at least 10 of the 100 sampled string records (or 10%) contain an “@”. In the case where all features have been extracted and no assign conditions have been satisfied, the pre-trained Logistic Regression model would only then be used to predict the category of the column under consideration. For each of the defined categories, a probability is computed using the values of the extracted features and the Logistic Regression weights.
If the largest predicted probability aggregated across all samples exceeds some specified PI assignment threshold, the column is assigned as a PI column with the category that achieved the highest predicted probability. If this threshold is not exceeded, the column is returned as a non-PI column.
5. Evaluating the systems performance
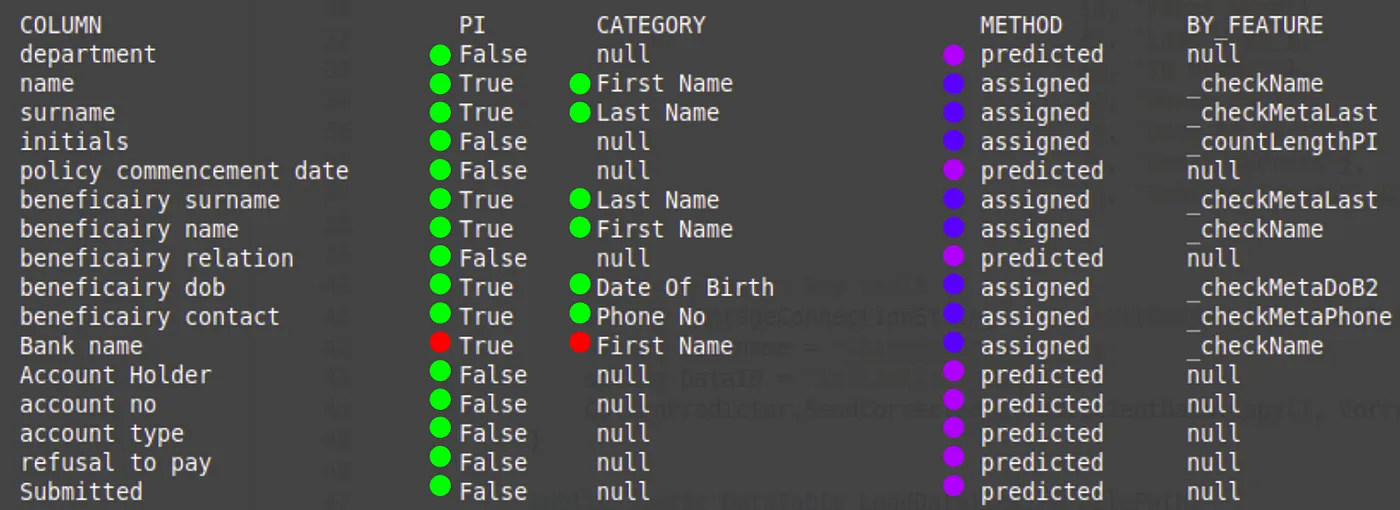
The final step in my formulation was to assess the solution’s performance in a real-life setting. For this, the client gave myself the challenge of correctly categorising 192 consumer data columns. Figure 5 shows a snippet of the evaluation procedure we followed, where green dots indicate a correct prediction and red an incorrect prediction. I also tracked whether the assigned category was the result of assignment by a feature or prediction by the Logistic Regression model, indicated by the blue and purple dots, respectively.
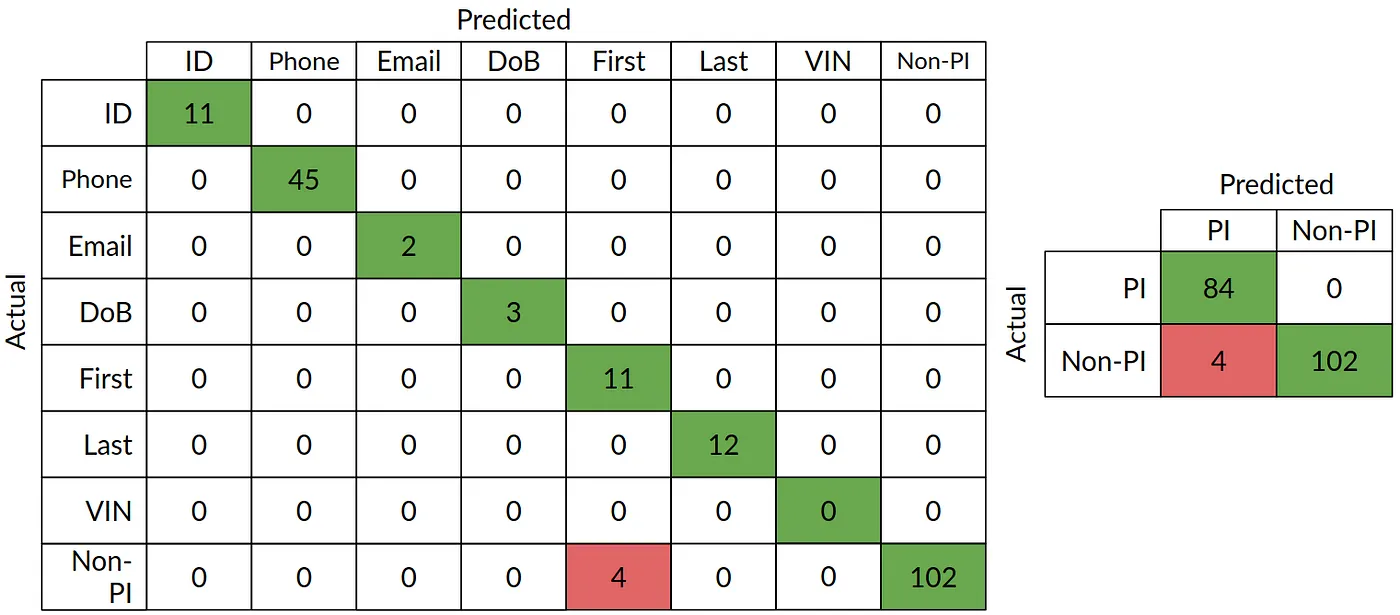
So, how well did my solution fare overall? Figure 6 shows the results of my evaluation in the form of a confusion matrix. I found that, overall, my solution was able to correctly classify 97.9% of the columns, where the Logistic Regression model contributed 26.6% of these predictions. Confusion typically arose when institution names were sometimes misclassified as first names by the Logistic Regression model.
The client was happy with this performance and we proceeded to the next phase of the project which entailed packaging the solution as a production-ready system for them.
6. Wrapping up
And that’s all! In this post, I walked you through my approach for automatically identifying sensitive data fields as well as how this solution was productionised in a real-world system. It goes to show that Machine Learning can be used to solve almost any problem.